There has been much discussion in the news recently about new nominal highs in stock indexes like the Dow Jones Industrial Average and the S&P 500. When markets hit new highs, is that an indication that it’s time for investors to cash out?
History tells us that a market index being at an all-time high generally does not provide actionable information for investors. Looking at S&P 500 data from 1926 through 2016, the proportion of annual returns that have been positive after a new monthly high is similar to the proportion after any index level. In fact, almost a third of monthly observations were new closing highs.
This shows that new index highs have historically not been useful predictors of future returns. Given that index levels alone don’t seem to drive future returns, you may ask a more fundamental question: What drives expected returns for stocks?
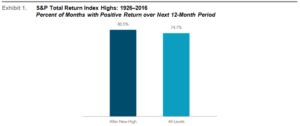
From January 1926 to December 2016, 319 months, or approximately 29% of monthly observations, were new closing highs.
Note: 1,081 monthly observations.
The S&P data is provided by Standard & Poor’s Index Services Group. For illustrative purposes only. Index is not available for direct investment. Past performance is no guarantee of future results.
Positive Expected Returns
One way to value an investment is to estimate its future cash flows and discount them to today’s dollars. For stocks, this links a firm’s expected profits to its current price through a discount rate (the investor’s expected return). Understanding the power of markets helps explain how these prices form across thousands of investors.
A key insight: expected return from a stock depends on the price paid and what investors expect to receive. Stock prices result from the interaction of willing buyers and sellers, who apply positive discount rates to expected profits. This is because there’s always risk that expected profits won’t materialize or prices will decline.
If investors apply positive discount rates to cash flows, stock prices should be set so expected returns are always positive. There’s little evidence that investor expectations—which set market prices—have been persistently biased downward or upward. Professional money managers have been unable to consistently outguess market prices.
Therefore, it’s reasonable to assume that stock prices (whether at new highs or not) are set at levels where expected returns are positive. This explains why new index highs haven’t typically been followed by negative returns. At any price level—high, low, or in between—expected returns remain positive. ## Expected Returns, Realized Returns and Holding Horizons
Today’s prices depend on expected returns and expectations about future profits. If either changes, prices will adjust to reflect new information. Changes in risk aversion, investor preferences, profit expectations, or risk quantity can all drive changes in expected returns.
When expected returns increase, prices drop. When expected returns decrease, prices rise. This means realized returns can differ from expected returns. The realized return on a stock, index, or the market as a whole can be negative even when expected returns are positive.
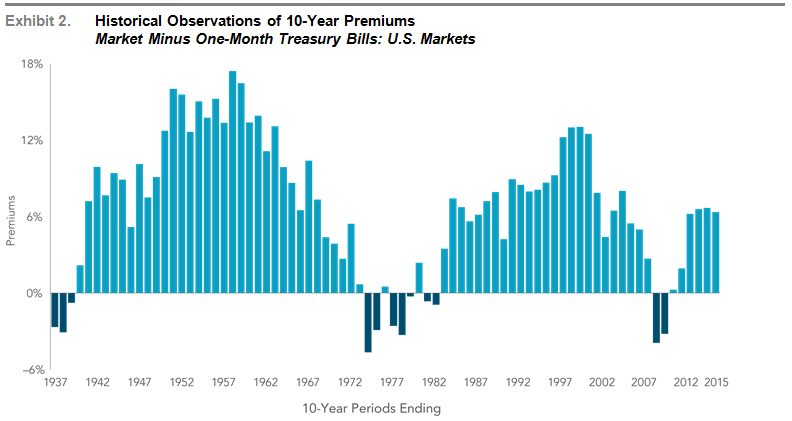
How does holding horizon affect the probability of negative returns? Exhibit 2 shows rolling 10-year performance of the equity market premium (equity returns minus one-month Treasury bill returns). Most periods showed positive results, but some periods underperformed.
Information provided by Dimensional Fund Advisors LP.
In US dollars. The 10-year rolling equity premium is computed as the 10-year annualized compound return on the Fama/French Total US Market Index minus the 10-year annualized compound return of the one-month US Treasury Bill. Fama/French indices provided by Ken French. Index descriptions available upon request. Eugene Fama and Ken French are members of the Board of Directors for and provide consulting services to Dimensional Fund Advisors LP. Indices are not available for direct investment. Their performance does not reflect the expenses associated with the management of an actual portfolio. Past performance is no guarantee of future results.
There is uncertainty around how long periods of underperformance may last. Historically, the probability of equity returns being positive increases over longer time periods.
Exhibit 3 shows the percentage of time the equity market premium was positive over different holding periods since 1928. As the time period increases, so does the chance the equity market premium was positive.
The answer is clear: as an investor’s holding period increases, the probability of a negative realized return decreases. This is why choosing a level of equity exposure you can stay invested in over the long term is critical.
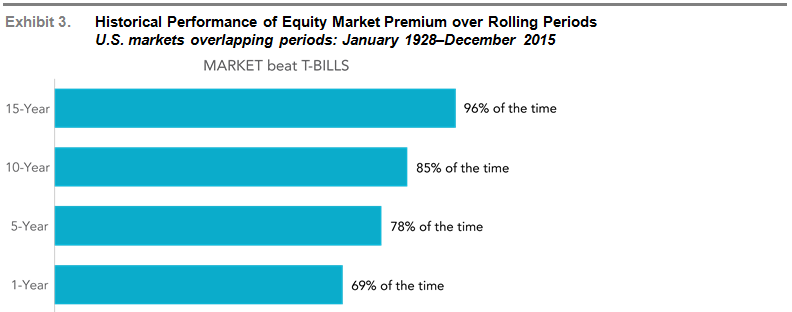
Market is Fama/French Total US Market Index. T-Bills is One-Month US Treasury Bills. There are 877 overlapping 15-year periods, 937 overlapping 10-year periods, 997 overlapping five-year periods, and 1,045 overlapping one-year periods.
Information provided by Dimensional Fund Advisors LP. Based on rolling annualized returns using monthly data. Rolling multiyear periods overlap and are not independent. This statistical dependence must be considered when assessing the reliability of long-horizon return differences. Fama/French indices provided by Ken French. Index descriptions available upon request. Eugene Fama and Ken French are members of the Board of Directors for and provide consulting services to Dimensional Fund Advisors LP. Indices are not available for direct investment. Past performance is not a guarantee of future results.
Conclusion
By themselves, new all-time highs in equity markets have historically not been useful predictors of future returns. While positive realized returns are never guaranteed, equity investments have positive expected returns regardless of index levels or short-term market moves.
The collective wisdom of market participants allows investors to rely on market prices to inform their investment decisions and assume positive expected returns from stocks. Over longer time horizons, the odds of realized stock returns being positive have historically increased.
This is why investors should consider investing as a long-term commitment. Staying invested and not making changes based on short-term predictions increases your likelihood of success. Learn more about how to avoid self-sabotaging your investments and behavioral mistakes that derail long-term plans. Our investment management approach incorporates these principles.
Source: Dimensional Fund Advisors LP. Past performance is no guarantee of future results. There is no guarantee an investing strategy will be successful. All expressions of opinion are subject to change. This article is distributed for informational purposes, and it is not to be construed as an offer, solicitation, recommendation, or endorsement of any particular security, products, or services.